Hackathon Judging Portal
A judging system designed to replace spreadsheet-heavy hackathon operations with a connected workflow for assigning judges, reviewing projects, and making award decisions.
What I owned
- I designed the Statistics Viewer, the part of the portal organizers use to review rankings and finalize awards.
- I mapped the end-to-end judging flow with the dev and logistics teams, from event setup to final award decisions.
- I ran the design loop with the team, reviewing each screen with developers and logistics and iterating to ship for HackCamp.
Impact
The problem
nwPlus runs hackathons where hundreds of projects move through judging in a short, high-pressure window. Much of that process depended on Google Sheets and manually assigning judges, tracking project reviews and finalizing awards.
Not only was this inefficient, but it was also extremely disconnected: important decisions were spread across many steps, which made it harder to track progress and handle edge cases.
So we asked:How might we help organizers turn incomplete, changing judging data into award decisions they can review, trust, and act on quickly?
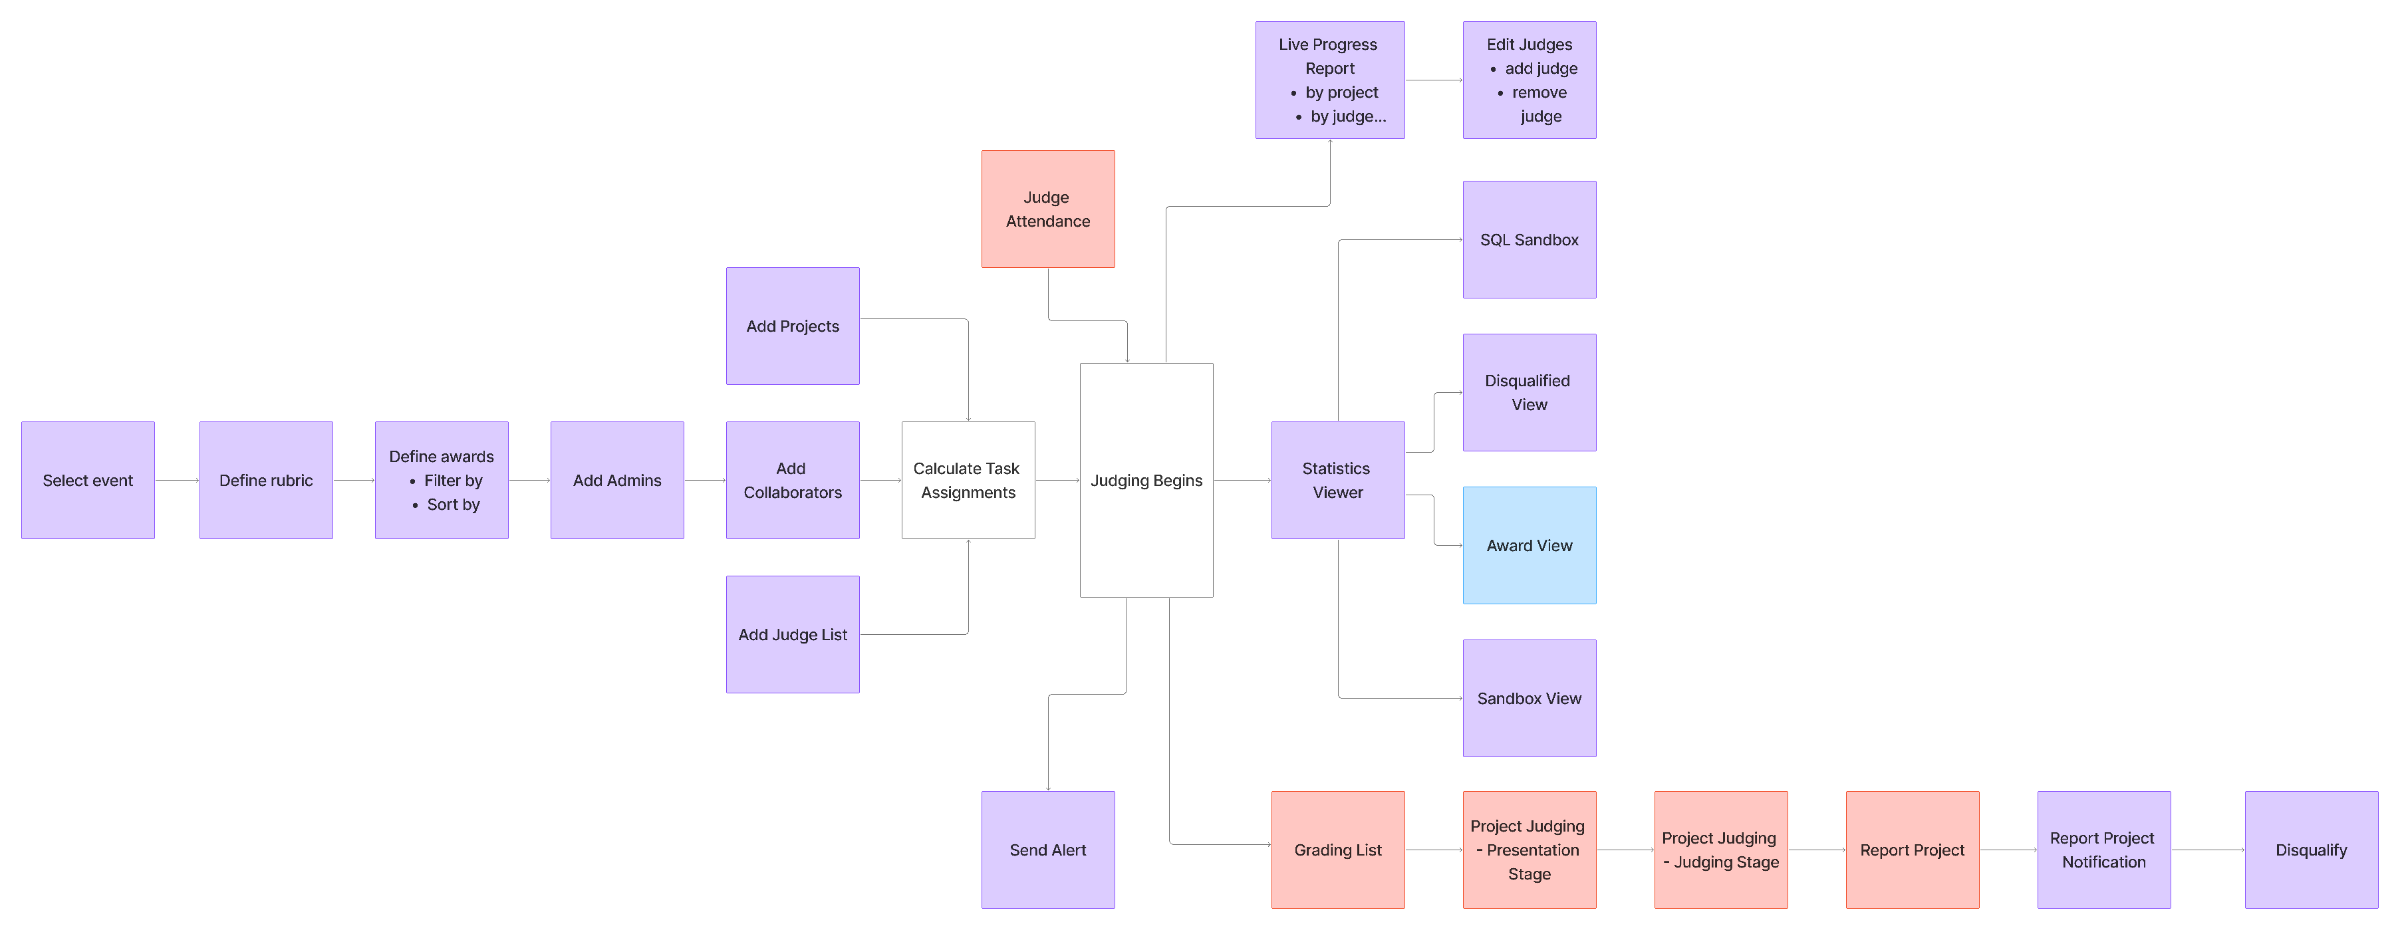
To answer that, we started with requirements. We sat down with the developers and the logistics team, our main stakeholders, to figure out what the system actually had to do and the constraints it needed to work within. Those conversations turned into the end-to-end judging flow below, covering every step from event setup and rubric definition through task assignment, judging, and final award decisions.
Once the flow was agreed on, we moved into design. We reviewed screens with the dev and logistics teams as we went, and kept iterating as new constraints and edge cases came up.
The scope
I focused on the Statistics Viewer. It's the part organizers turn to once judging is underway, where they review rankings, dig into anything that looks off, and lock in the final award decisions. My job was to make that last stretch feel clear and trustworthy, even when the data underneath was still messy or coming in.
That meant designing for a moving target. Scores were still landing while organizers were trying to make calls, so the view had to stay readable whether it was half full or complete, and it had to make the state of the data obvious at a glance.
The question for my pieceHow do you help an organizer make a confident award call when the scores are still incomplete and shifting under them?
Where it kept breaking
Before the portal, finalizing awards on top of spreadsheets created the same problems at every event:
- Rankings were always a little out of date. Scores came in throughout judging, so any list organizers looked at could change minutes later.
- Exceptions hid in the noise. Projects with missing scores, uneven judge counts, or flags were buried in rows, with nothing to pull them to the surface.
- There was no single source of truth. Scores, judge assignments, and awards lived in separate sheets, so picking a winner meant cross-checking by hand.
- Decisions were hard to defend. Organizers needed to explain why a project won, but the numbers didn't make that reasoning easy to see.
From requirements to flows
I started from the requirements we gathered with the dev and logistics teams, then mapped the organizer's path through judging and turned it into screens. From there it was a tight loop: design a view, walk through it with the devs to check it was feasible and with logistics to check it matched how events actually run, then iterate.
The biggest shift came from watching how organizers actually use this data. They don't read a table top to bottom, they scan for what's wrong. That pushed the design away from "show everything" and toward surfacing the projects that need attention first, then letting organizers drill in from there.
One award at a time
The hardest call was how to structure the view. A single master leaderboard felt powerful, but it forced organizers to hold every award, category, and edge case in their head at once. Instead, I organized the Statistics Viewer around individual awards: each one opens into its own ranked list, with exceptions and missing data flagged in context.
It's a little more clicking, but it matches how decisions actually get made, one award at a time, and it keeps each call focused and easy to defend. It also kept the data honest, since organizers always saw the full picture for the award in front of them instead of a flattened summary.
The shipped portal
The result is a Statistics Viewer that lets organizers move through awards one by one, see ranked projects with their scores, catch anything that needs a second look, and finalize decisions in the same place. No exporting, no cross-referencing sheets.
Outcomes
The portal shipped and ran judging at HackCamp, where organizers finalized awards inside the tool instead of stitching spreadsheets together at the end of the night.
Reflection
Designing for data that's incomplete and constantly changing taught me to design for the messy middle, not just the finished state. A view that looks great with perfect data falls apart the moment a score is missing, so the real work was making "not done yet" feel just as clear as "done."
Building this close to the dev and logistics teams also changed how I work. Reviewing each screen with them as I went meant fewer surprises and a design that held up on event day. If I did it again, I'd test earlier with organizers under real time pressure, since that's when the edge cases really show up.